


Gainers don’t exceed losers yet
There’s a lot of crowing, especially from the banking profession, about the latest report that the quarterly gross national product (GNP) grew by over 7 percent from last year. The new figures are nice to see, but they don’t mean one can already relax.
Recovery of aggregate production to pre-pandemic times requires not only achieving the GNP of 2019 but also coping with the population growth—about 1.3 percent per year—since then. That would mean two more quarters, perhaps, of 7-point GNP growth.
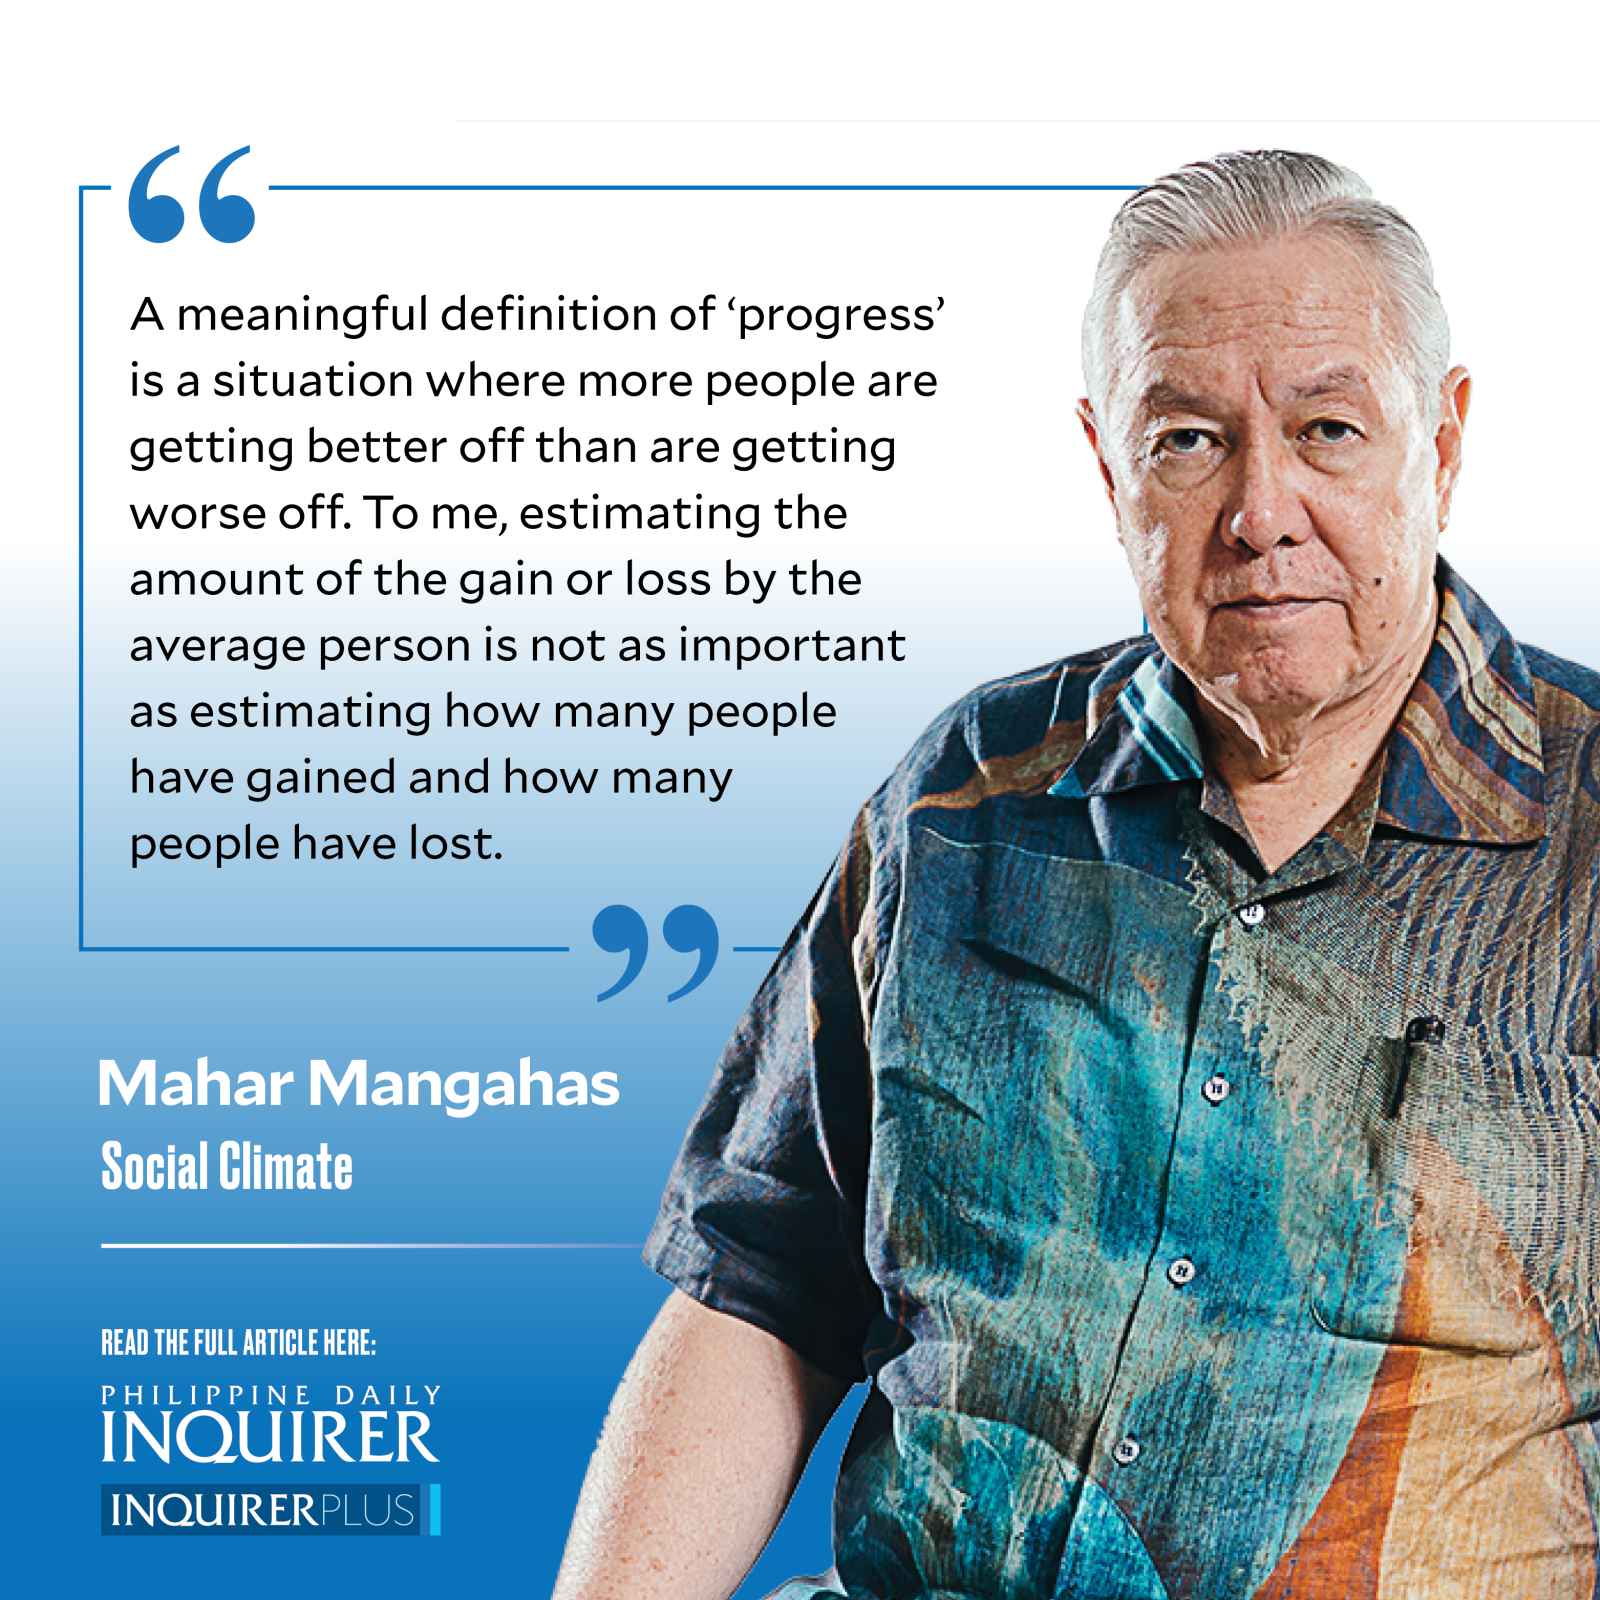
Article continues after this advertisementI think that the sharing of the growth is just as important as the size of the growth itself. A meaningful definition of “progress” is a situation where more people are getting better off than are getting worse off. To me, estimating the amount of the gain or loss by the average person is not as important as estimating how many people have gained and how many people have lost.
In my piece, “Count people, not money” (9/24/22), I said: “Gainers need to outnumber Losers again, like they did just before the pandemic. … Would you believe that, in 145 surveys from 1983 to the present, while there was almost always positive growth in real (i.e., corrected for inflation) gross national product per person, only 21 of those surveys found more Gainers than Losers? This is the clearest proof against the trickle-down theory of economic growth.”
In its June 2022 survey, out of every 10 adults, SWS found 3 gainers and 3 losers in personal quality of life (QOL), while the balance of 4 had their QOL unchanged (“31% of adult Filipinos got worse off in the past 12 months; 29% got better off, 39% stayed the same,” www.sws.org.ph, 9/14/22). This will be updated soon from the SWS October 2022 survey.
Article continues after this advertisementJune 2022 was a strong national recovery from the catastrophic 6 percent gainers versus 83 percent losers in May 2020; that’s net -78, properly rounded. But it was very far short of the record best net +18 in December 2019 before COVID-19 struck, from 39 percent gainers versus 21 percent losers.
As might be expected, the distribution of the gainers-losers recovery is biased toward the socially advantaged. By area, the gainers-losers net scores were: +6 in the National Capital Region, +5 in Balance of Luzon, -7 in Mindanao, and -17 in the Visayas. By educational attainment, the gainers-losers net scores were: +3 for junior high school graduates, +2 for college graduates, -7 for elementary graduates, and -17 for non-elementary graduates.
The net scores of gainers versus losers are definitely worse for the poor than for the non-poor, and definitely worse for the hungry than for the non-hungry. Observing poverty, hunger, and change in quality of life in the same survey makes it possible to relate all these together.
The Consumer Expectations Survey (CES) has quarterly data on gainers and losers that could be used in economic planning. The CES is a probability-based national survey of households, paid for by the Bangko Sentral ng Pilipinas (BSP), for quarterly implementation by the Philippine Statistics Authority.
The CES asks its respondents whether their “economic condition,” “family financial situation,” and “family income” have gotten better, gotten worse, or stayed the same compared to a year ago. It also asks respondents to compare the coming year with their situation today. The CES has been regularly conducted and published for several years, also using net positive/negative scores in presenting its findings.
At a plenary session of the Philippine Economic Society’s annual conference last week (11/9/2022), the National Economic and Development Authority sponsored a panel on development planning for 2023-2028. Undersecretary Joseph Capuno (subbing for secretary Arsenio Balisacan who was at a Senate hearing) spoke for Neda. In the Q&A period, I spoke up to recommend that such planning incorporate the gainers-losers concept, citing the availability of pertinent CES data. A BSP participant confirmed that data from CES and the SWS surveys of Gainers/Losers and Optimists/Pessimists tally over time, by area, and by education. The reaction of Capuno and comments from the floor all seemed positive.
——————
Contact: mahar.mangahas@sws.org.ph
###—###
#ColumnName
Social Climate
Mahar Mangahas


