Watch poverty, not economic growth
Social Weather Stations has just issued the first report from its April 19-27, 2022 survey: “43% of Filipino families feel Poor; 34% feel Borderline Poor, 23% feel Not Poor,” www.sws.org.ph, 5/18/22. It is the 133rd Self-Rated Poverty survey since 1983 (“132 surveys in 40 years,” inquirer.net, 3/26/22).
The Self-Rated Poverty (SRP) indicator—where the responding household head classifies her/his family by pointing to the word Mahirap, rather than the negative Hindi Mahirap, or the (unprompted) line in-between—was designed for rapid monitoring of poverty over time. Because so many point to the Borderline, poverty measurement really involves not two, but three, categories.
Article continues after this advertisementSRP was first surveyed in 1983, then in 1985, then twice a year in 1986-91, and then quarterly since 1992 (except for the first three quarters of 2020, when face-to-face fieldwork was not possible). Every report updates the series of data, in charts and numbers, since the beginning.
The SRP data clearly indicate that growth of the economy (gross national product per capita) takes decades to make an impact on poverty. In particular, despite the reported burst of economic growth in the first quarter of 2021, the April 2022 SRP of 43 percent is the same as its previous rate in December 2021 (with gains in Balance Luzon and Visayas offset by losses in Metro Manila and Mindanao).
Poverty under various regimes. The SRP percentage was 55 in April 1983, and then 74 in July 1985, averaging to 64.5 under Ferdinand E. Marcos (FEM). The first figure was at a relatively calm time, prior to the assassination of Ninoy Aquino. The second was during hyperinflation of 50 percent in 1984 and 25 percent in 1985. Movements in SRP are significantly correlated to price inflation, and only slightly related to GNP (per capita, adjusted for inflation).
Article continues after this advertisementFor other presidents, I will take the SRP average annual percentages during their full calendar years in office, i.e., including July-December of their final year, which I think is too soon for crediting or blaming the successor. These annual averages are given in the SWS report, after the original within-year percentages.
In the seven calendar years of 1986-1992, under Corazon C. Aquino (CCA), the annual average SRP percentages were, chronologically, 67, 47, 66, 62, 68, 67, and 66, averaging 63.3. (Note: inflation was near zero in 1987.)
In the six years 1993-1998, under Fidel V. Ramos (FVR), the annual average SRPs were 65, 68, 63, 59, 59, and 61, averaging 62.5. (Note: there was a severe rice price crisis in the third quarter, or the lean rice harvest months, of 1995.)
In the three years 1999-2001, under Joseph E. Estrada (JEE), the SRPs were 61, 57, and 62, averaging 60.0. (Although he left office in February 2001, let us credit his regime with the SRPs up to the end of 2001.)
In the nine years 2002-2010, under Gloria M. Arroyo (GMA), the SRPs were 63, 60, 51, 53, 54, 50, 53, 49, and 48, averaging 53.4.
In the six years 2011-2016, under Benigno S. Aquino III (BSA3), the SRPs were 49, 52, 52, 54, 50, and 44, averaging 50.2. (The Conditional Cash Transfer program, the first government program with a mechanism for targeting the poor, was introduced in 2009, and maintained in the next two regimes.)
In the five years 2017-2021, under Rodrigo R. Duterte (RRD), the SRPs were 46, 45, 45, 48, and 46, averaging 46.0, close to what was inherited from BSA3. (In 2020, the first pandemic year, SRP was surveyed only in November, when face-to-face surveying resumed; but it had surely zoomed earlier that year, when Hunger and Joblessness, interviewed by mobile phone from the SWS database of its respondents of 2017-19, reached catastrophic levels.)
The SRP surveys are the only source of consistently-measured poverty statistics that go back to the FEM regime. They show that poverty exploded in 1983-85, then fell raggedly under CCA, FVR, and JEE, and regained the 1983 base only midway under GMA two decades later. Poverty fell some more under BSA3; then it went flat under RRD (discounting the probable catastrophe in 2020).
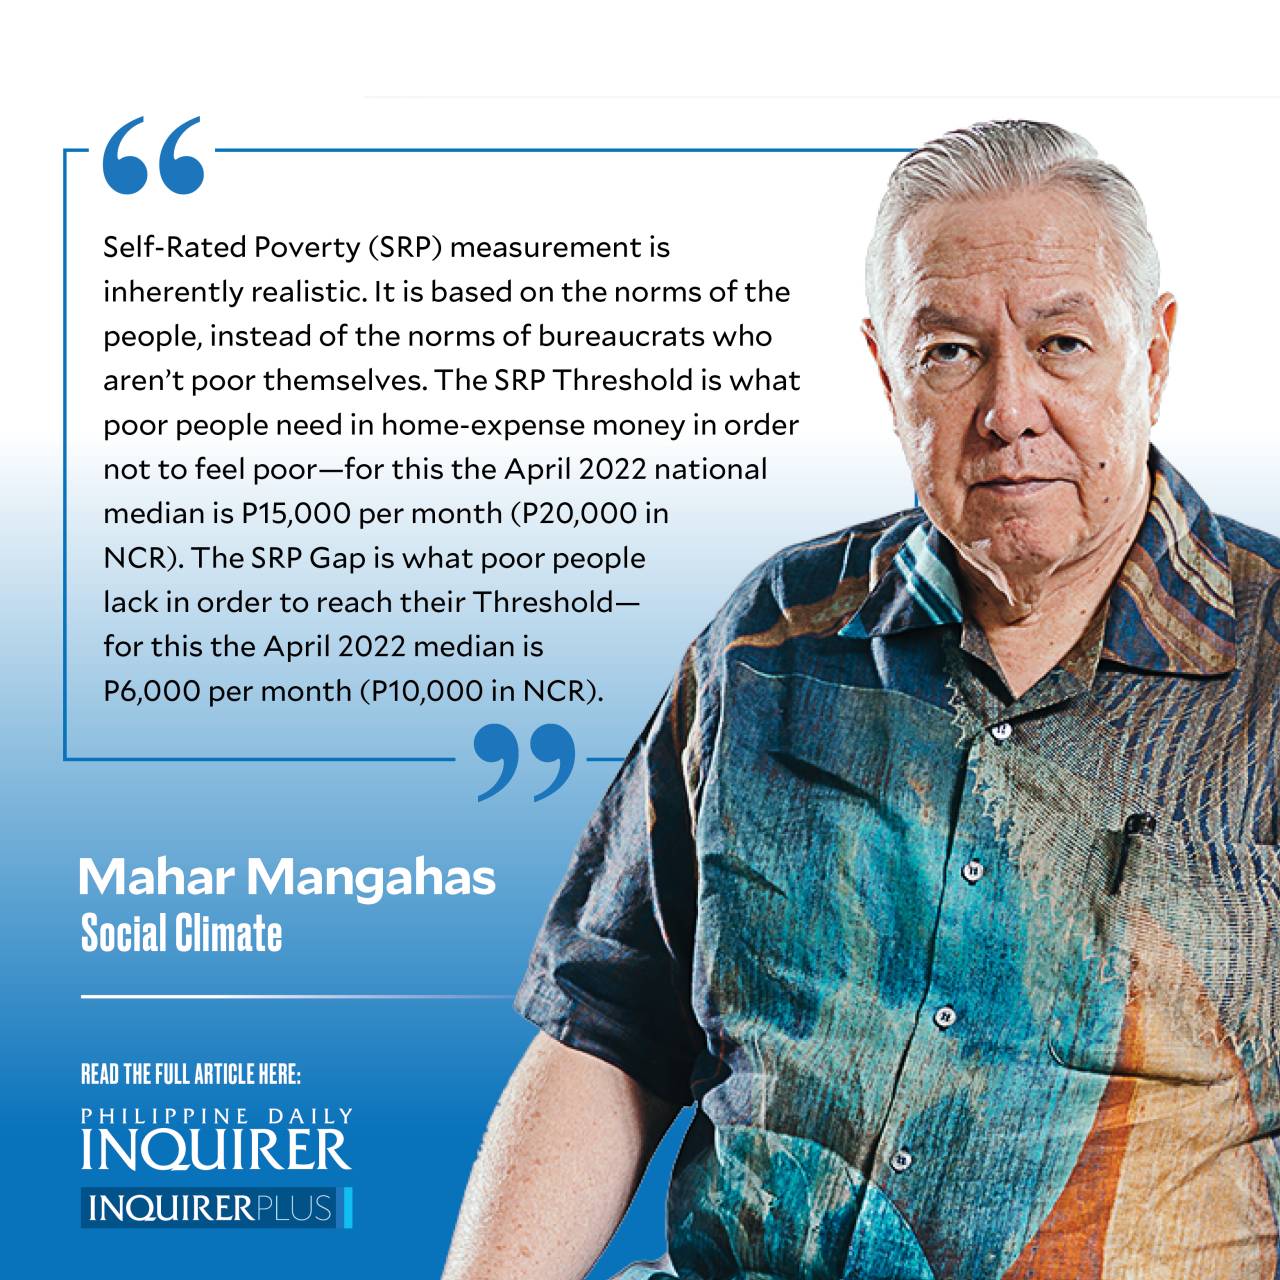
Self-Rated Poverty measurement is inherently realistic. It is based on the norms of the people, instead of the norms of bureaucrats who aren’t poor themselves.
The SRP Threshold is what poor people need in home-expense money in order not to feel poor—for this the April 2022 national median is P15,000 per month (P20,000 in the National Capital Region). The SRP Gap is what poor people lack in order to reach their Threshold—for this the April 2022 median is P6,000 per month (P10,000 in NCR).
Poverty statistics do not cure poverty; they only diagnose the situation. But the first step in finding the cure is not to be afraid of regular diagnosis.
——————
Contact: mahar.mangahas@sws.org.ph


