Count people, not money

The dollar-peso rate is merely how some green paper that Americans accept for their products is bartered for some multicolored paper that we Filipinos accept for our products. Regardless of its fascination for journalists, it doesn’t affect the well-being of Filipinos in general.
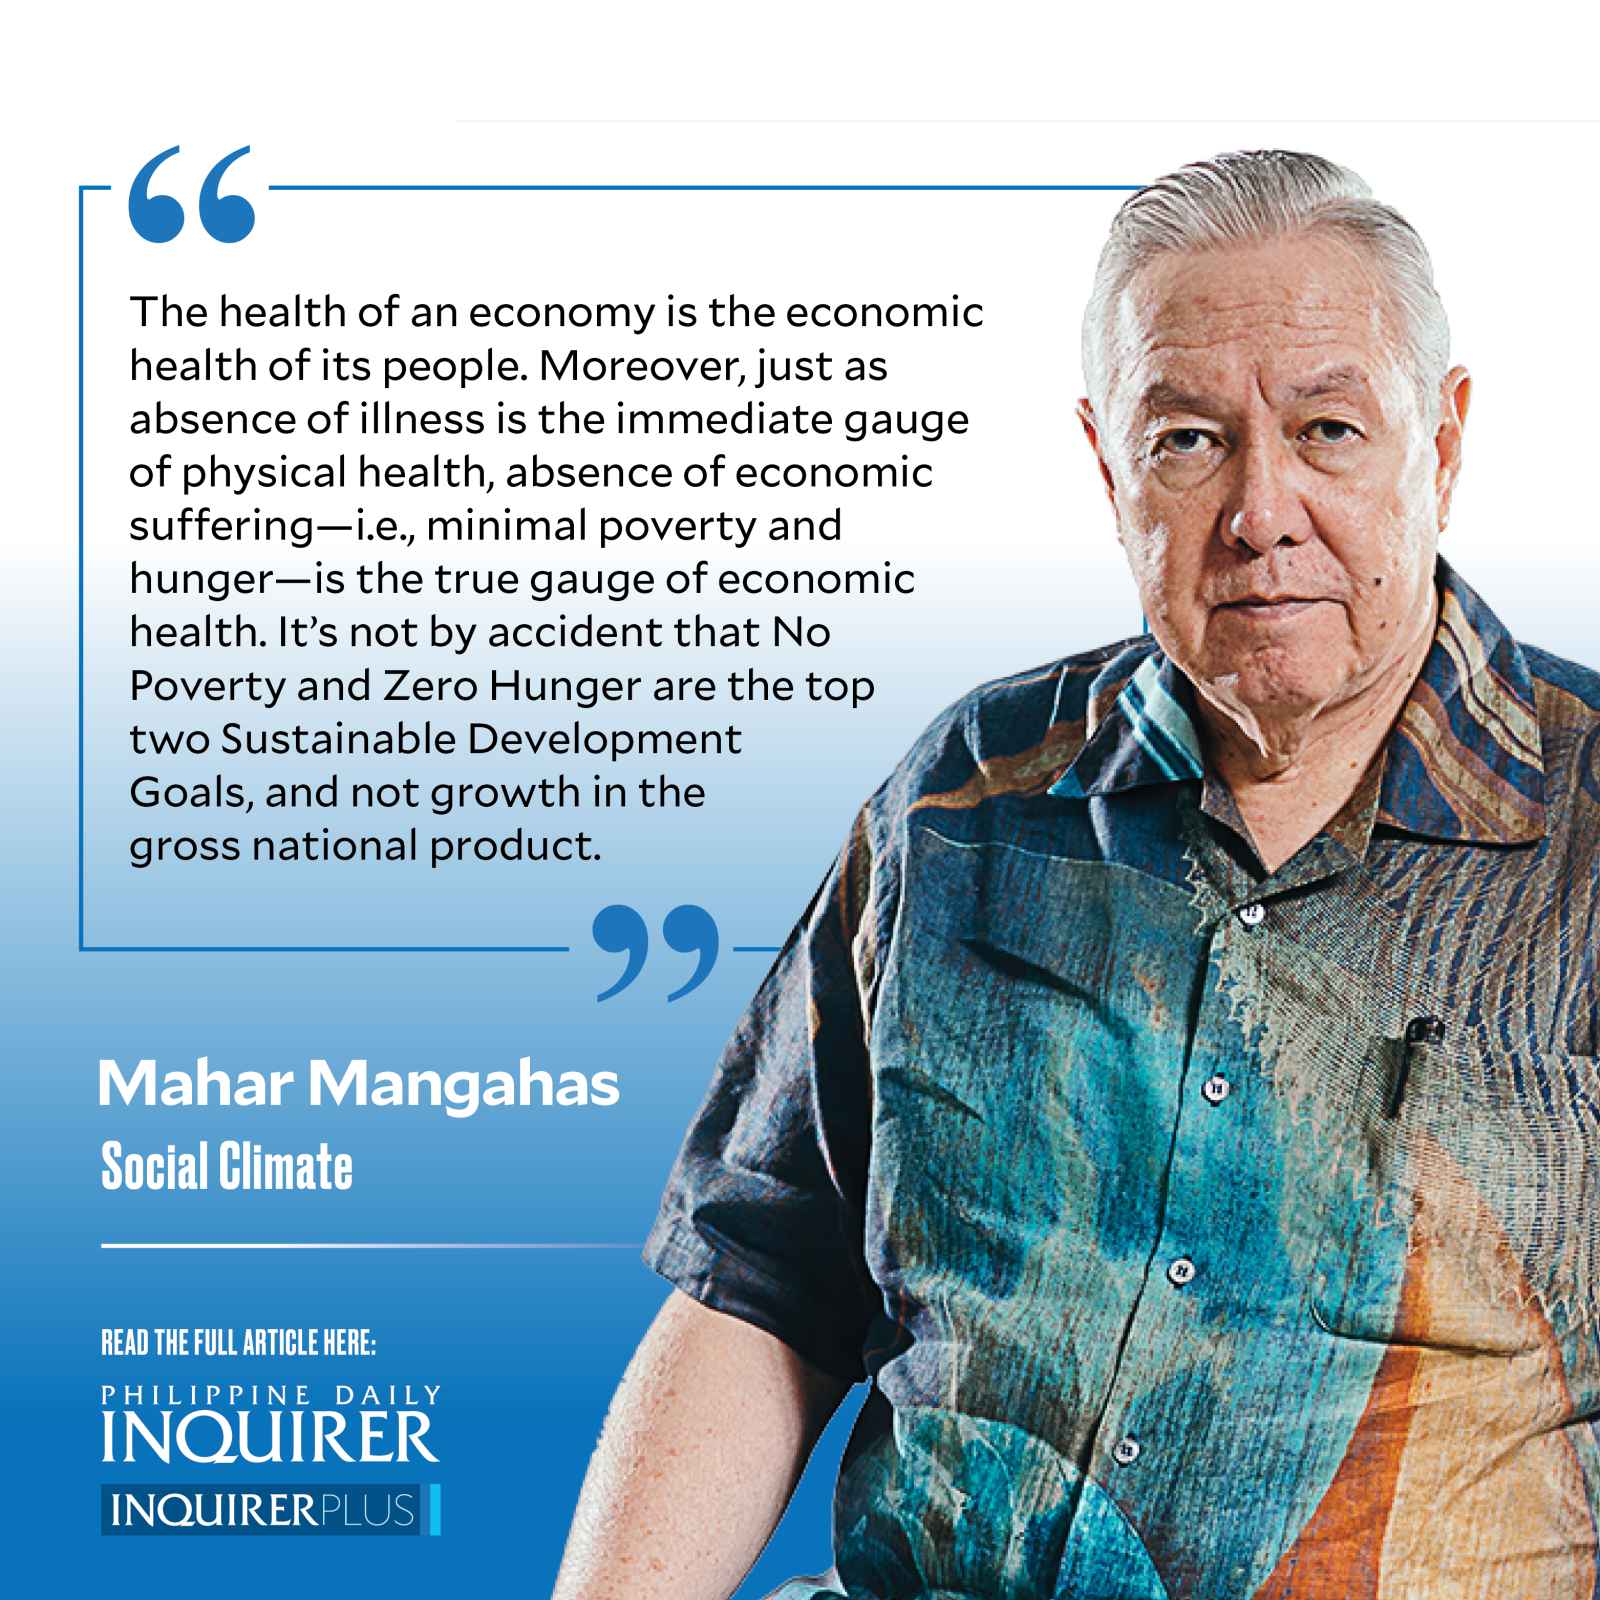
The health of an economy is the economic health of its people. Moreover, just as absence of illness is the immediate gauge of physical health, absence of economic suffering—i.e., minimal poverty and hunger—is the true gauge of economic health. It’s not by accident that No Poverty and Zero Hunger are the top two Sustainable Development Goals, and not growth in the gross national product.
Self-Rated Poverty (SRP) has declined very gradually, and is still in the 40s. The percentage of Self-Rated Poor families peaked at 74 percent in 1985, amid the hyperinflation years of 1984 and 1985. It was surveyed twice a year in 1986-91 and then quarterly since 1992 (except for 2020Q1-Q3 when face-to-face interviewing was impossible). Its movements were ragged, but its average gradually fell from the ’70s, to the ’60s, ’50s, and then ’40s (see “Watch poverty, not economic growth,” 5/21/22).
It presumably exploded in the lockdown times of 2020, when SRP was surveyed only in November. In four 2021 rounds, SRP averaged 46 percent. Then it rose significantly from 43 percent in Q1 to 48 percent in Q2—this is more recent than official poverty, its last date being 2021. Thus, current poverty is just as bad as pre-pandemic, when average SRP was 45 in 2019, 48 in 2018, and 46 in 2017.
Bear in mind that the Philippines has 25 million families, and so one percentage point amounts to 250,000 families. The natural way of counting the poor (as well as the hungry) is in terms of families, not individuals.
The direct way of helping reduce poverty is by using poverty-targeted programs, such as the conditional cash transfer, honestly implementing them, and not cutting them off too soon, before they have taken root.
Hungry families are at 12 percent in 2022, a throwback of five years. Before the pandemic, the 4-quarter average percent hungry had been steadily improving: 19.9 in 2011 (the previous peak), 19.9 in 2012, 19.5 in 2013, 18.3 in 2014, 13.4 in 2015, 13.3 in 2016, 12.3 in 2017, 10.8 in 2018, and 9.3 in 2019.
But in the first pandemic year of 2020, the average percentage was a catastrophic 21.1, with a new all-time peak of 30.7 in Q3. The average simmered down to 13.1 percent in 2021. In 2022, hunger was 12.2 in Q1 and 11.6 in Q2, or about the same as the 2017 average, five years ago. It is still short by 2 points, or half a million families, of full recovery to pre-pandemic 2019.
The direct way of helping reduce hunger is by creating safety nets to feed the hungry. This can be done by both public and private institutions.
Gainers need to outnumber Losers again, like they did just before the pandemic. One of the oldest, and easiest, questions to ask in a poll is on whether the respondent has gotten better off, or worse off, or neither, compared to some time past; this is the Gainers versus Losers question. The SWS surveys ask for comparison of quality of life (uri ng pamumuhay) at present versus a year ago.
Would you believe that, in 145 surveys from 1983 to the present, while there was almost always positive growth in real (i.e., corrected for inflation) gross national product per person, only 21 of these surveys found more Gainers than Losers? This is the clearest proof against the trickle-down theory of economic growth.
The dominance of Losers over Gainers narrowed to single-digits by mid-2010, under the administration of President Benigno S. Aquino III. At last, by March 2015, Gainers began to dominate over Losers. They continued to do so in the time of President Rodrigo Duterte, reaching a peak of 41 percent Gainers versus only 18 percent Losers, or Net +23, in 2017Q4. After a brief stumble to Net -2 in 2018Q3, the dominance of Gainers went double-digit again, and was a good-looking +18 in 2019Q4, before the pandemic struck.
Then came catastrophe, bottoming at Net -78 in May 2020. The average of Gainers minus Losers was Net -69 in 2020; it softened to Net -32 in 2021. The latest net scores are -2 in both 2022Q1 and 2022Q2, still some 20 points short of pre-pandemic, but with recovery in sight.
The way forward to the people’s economic health is to identify the right targets, focus one’s eyes on them, and steadily apply the proper remedies, until the targets are achieved.
——————
Data are from media releases of the Second Quarter 2022 Social Weather Survey (www.sws.org.ph): “48% of Filipino families feel Poor; 31% feel Borderline Poor, 21% feel Not Poor,” 8/2/22; “Hunger eases from 12.2% to 11.6%,” 9/10/22; and “31% of adult Filipinos got worse off in the past 12 months,” 9/14/22.
——————
Contact: mahar.mangahas@sws.org.ph


