How the government evaluates itself

It is time again for the Sona—State of the Nation Address—and naturally, President Duterte is the central figure. He has been in office for a little over five years, and it is his last Sona.
In preparation for this event, the media (this paper included) has been evaluating the President’s accomplishments and failures, mostly based on his previous Sonas. Something like: He said he would do this in his first Sona (or second, or third, or fourth)… Has he done it? That takes a lot of dogwork. And leaves the researchers open to charges of bias or selectiveness.
This column will not go that route. Rather, I will use StatDev (Statistical Indicators on Philippine Development). To remind, StatDev is “ an instrument formulated and maintained by the Philippine Statistics Authority (PSA)… It aims to serve as an early warning measure by showing the likelihood of achieving the economic and social development goals set forth in the Philippine Development Plan (PDP), including the midterm updates.“
StatDev monitors the targets in the Results Matrices of the PDP and calculates the likelihood of their achievement. The data are reported by a reporting entity (e.g., BSP, Neda, DOJ) and are provided by the responsible agencies (which may or may not be the same as the reporting agencies).
It is a herculean effort, but in July each year, StatDev issues a report so that the administration can use the data for the Sona of the President, the idea being that the President’s report will be evidence-based.
Since the start of StatDev in 2006, the PSA has made it conveniently ready for the President’s reference. Last year was an exceptionʍthe pandemic apparently reduced the government agencies’ ability to report, and the StatDev came out after the Sona with very little data.
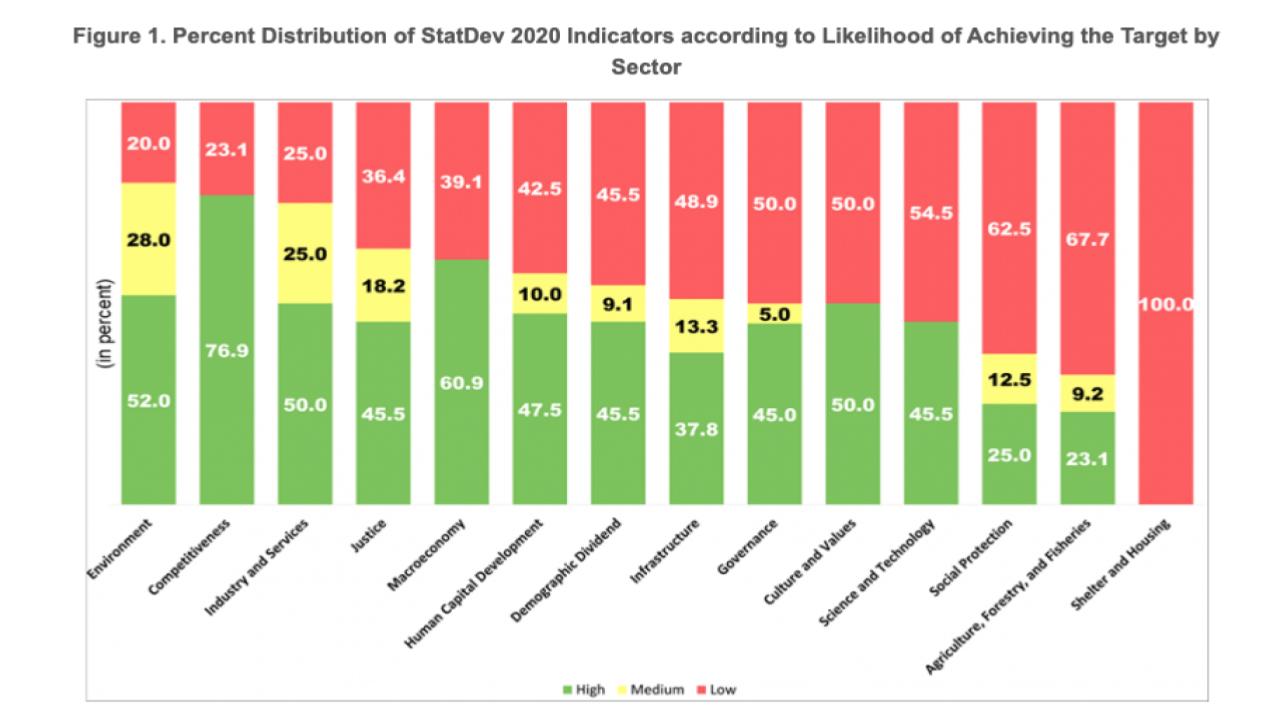
But this year it came out as scheduled on July 19 or thereabouts. Just so nobody can accuse me of fake news or bias, let me show you the summary in the PSA website (featured slide).
A little explanation: The 14 sectors and the likelihood of the targets being achieved are part of the three pillars, “Malasakit,” “Pagbabago,” and “Patuloy na Pagunlad,” of the PDP 2017-22 and correspond to chapters therein.
It is noteworthy, Reader, that the chapters “Attaining Just and Lasting Peace” and “Ensuring Security, Public Order and Safety” do not have published targets, on the grounds of national security. Thus, such items as drugs, crime, and the communist insurgency cannot be monitored by the PSA. So we the people cannot see how effective our government is in dealing with these.
Here’s how you read the chart. Take the rightmost bar, Shelter and Housing. It says 100 (in red if colored). That means that as of the end of 2020, there is absolutely no likelihood that any of the government’s Shelter and Housing targets will be met by the end of the Plan period.
If the bar has two or three figures, the bottom figure will tell you what percentage of the targets in the column has a high likelihood of being achieved. For example, the third bar on the right tells us that only 25 percent of the Social Protection targets have a high likelihood of being achieved while 62.5 percent of the targets have a low likelihood, and 12.5 percent have a medium likelihood.
High likelihood means greater than 0.9 probability of achieving end-of-plan target; medium means 0.6-0.9; low means less than 0.5. The methodology used is by the UNSIAP (United Nations Statistical Institute for Asia and the Pacific) for tracking Millennium Development Goals.
Have fun with the bar chart, Reader. Remember, this is the government evaluating itself, based on the best evidence it has.
——————
solita_monsod@yahoo.com


