Prolonged hunger in NCR

What strikes me most about the new Social Weather Stations hunger survey is that the richest area of the country, the National Capital Region (NCR), is again the one with the highest proportion of hungry households.
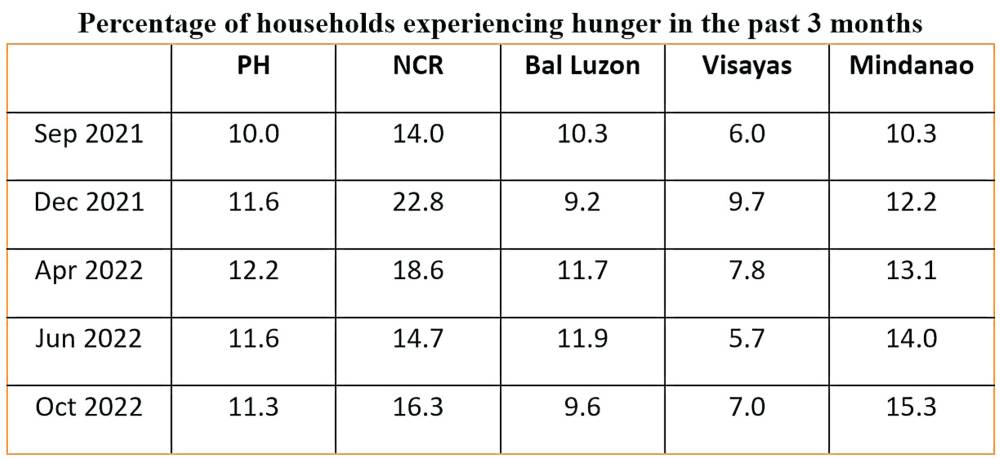
All SWS national surveys can be disaggregated into four study areas: NCR, the Balance of Luzon, Visayas, and Mindanao. In 25 of 99 hunger surveys since 1998, the area with the highest hunger rate has been NCR. In the last five surveys, in particular, NCR is consistently the area with the most hunger (see table).
Why should the richest area of the country persistently have the worst hunger? This indicates a steady widening of economic inequality in the capital!
Since September 2021, the second hungriest area has been Mindanao. Most of the time, the third hungriest is Balance Luzon, and the least hungry is the Visayas. To compare the rates across areas, use a sampling error margin of plus/minus 6 percentage points for each (the area rates are equally accurate, by design).
In October 2022, the hunger rates in NCR and Mindanao are statistically the same; hunger in Balance Luzon and Visayas are likewise similar. But the hunger rates of NCR and Mindanao are definitely higher than those in Balance Luzon and Visayas. This geographical pattern has been maintained for over a year now, during which time the national hunger rate has been flat at between 11 and 12 percent.
Average national hunger in 2019 was 9.3 percent, after five years of steady decline. Then in 2020, it shot up to a disastrous 21.1 percent. It simmered down in 2021 to 13.1 percent. Not until it falls to single digits can one say that the country has gotten over the pandemic.
Moderate and severe hunger. The SWS hunger rate is based on the household heads saying the family suffered hunger at least once in the past three months, without having anything to eat, i.e., the hunger is not voluntary fasting (as during Muslim Ramadan) or dieting.
A follow-up question is whether the experience was only once, a few times, often, or always (minsan lamang, mga ilang beses, malimit, o palagi). Households with the first two answers are called “moderately” hungry; those with the next two are called “severely” hungry.
In NCR, the 1.6-point increase in the total hunger rate from June to October 2022 was because moderate hunger fell by 0.6 points, while severe hunger rose by 1.0 point. By October, households severely hungry were 194,000—the largest of the four areas—while those moderately hungry were 365,000 (estimated by applying the survey rates to the officially projected 3.42 million households in NCR).
The size of the NCR survey sample is too small to zoom in to locate the hungry, but all its cities and municipalities are properly represented in the sample. Neither can the hungry in any other area be precisely located, for lack of “pixels.”
Who can be responsible for the people’s welfare in NCR, which has no regional government? I think that surveys of human well-being at subnational levels can, and should, be done by local government units and research institutions, public or private, with local mandates.
I don’t see why the national government should be tasked with surveying income and expenditures at the provincial and city levels, for instance; this overloads the Philippine Statistics Authority with humongous sampling and data processing, and leads to extremely delayed public reporting of the findings.
The minimization of suffering is much more important than the maximization of contentment. It justifies allocating more resources to the rapid surveillance of poverty and hunger.
——————
Contact: mahar.mangahas@sws.org.ph.


