The Philippines’ ‘buwaya problem’

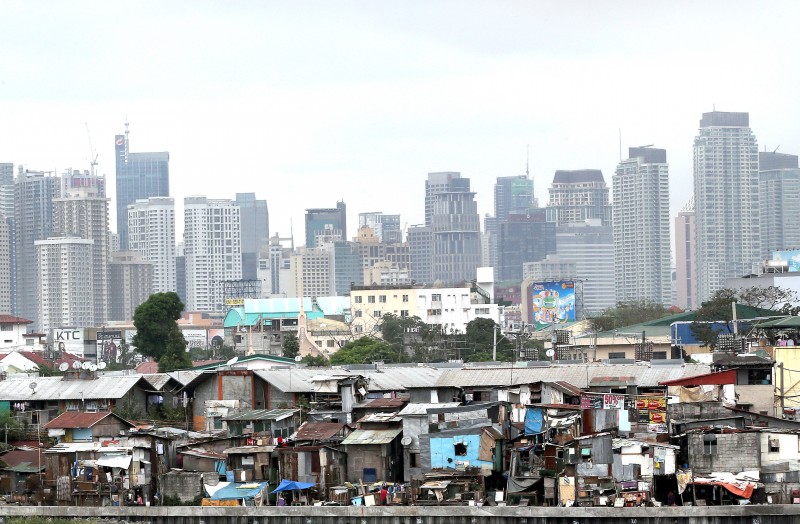
THE GREAT DIVIDE The growing gap between the rich and the poor is best illustrated in this photograph showing the midrise buildings and skyscrapers of the Makati Central Business District overlooking the shanties of Barangay San Roque Riverside in Pasay City. RAFFY LERMA
All our candidates in one form or another are of course promising faster growth and improved development outcomes. What has been the Philippine track record on growth?
When asked to do an economic briefing two days ago, I decided to tackle the issue. I decided to look at the forest rather than the trees—the big picture, as it were. The title of my talk was “The Philippine Economy: A Long (and Wide) View.”
Article continues after this advertisementAnd it was a long view—showing the growth rates of the Philippine economy, post-World War II (courtesy of the Philippine Statistical Authority), and then comparing these with those of other countries over a 50-year period (1960-2009). The 50-year comparison comes from the Economic Development text I use (Perkins, 7th Edition) at the University of the Philippines.
The table shows each country’s per capita GDP (measured in international dollars) in 1960 and then in 2009, and computes average growth rates. It divides developing countries into four categories—those that showed negative growth over the period, those that showed slow growth (from 0 percent to <2 percent), moderate growth (2 percent to 3 percent) and rapid growth (>3 percent). Not all countries are included, only those for which data are available over the 50-year period—about 34 developing countries.
The Philippines was categorized as a slow growth country, its per capita GDP growth rate averaging 1.58 percent. Its Asean, East Asian (South Korea, China), or even its South Asian (India, Sri Lanka) neighbors were rapid growth countries.
Article continues after this advertisementActually in 1960, the Philippines was ahead of the pack (except for South Korea) with per capita income of $1,313. Everybody else’s was lower (China’s per capita income was $403). By 2009, that had been completely reversed. Philippine per capita income was P2,838. The comparator countries all had higher per capita incomes.
A counterfactual: Had the Philippines grown as fast as Thailand (4.4 percent), our per capita GDP (pcgdp) would have been $10,635 instead of only $2,838. Even if we grew only as fast as India (3.14 percent), our 2009 pcgdp would have been $5,477. Doesn’t that make the Reader sick?
What causes the differentials in country growth rates? Studies by Sachs, and the Asian Development Bank, have narrowed the contributing factors to four: Initial Conditions, Natural Resources and Geography, Government Policies and Institutions, and Demography. Sachs studied the Philippines over the period 1965-1990, during which our pcgdp growth rate was actually 5.3 percentage points a year behind those of the Asian Tigers (South Korea, Taiwan, Hong Kong and Singapore), and 3.3 percentage points behind the Tiger Wannabes (Indonesia, Thailand, Malaysia) and China. He found that the largest contributing factor to these differences was government policies and institutions. These were responsible for between 70 percent and 79 percent of the differences in growth rates. These findings were confirmed by ADB studies.
So now we know what the culprits are, right? Wrong policies, weak institutions. Therefore, Reader, you should ask: Who are responsible for these? Short answer: our political leaders (now the connection to elections is clear). This I call our “buwaya problem”—which is the surfeit in this country of political leaders “whose decisions, supposedly taken for the public good, are in truth motivated by a desire for private gain and result in policies and projects that impoverish rather than enrich our country.” The “buwaya problem” is compounded by even more greed, because these politicians find “public service” so lucrative that they decide to make a family enterprise out of it, creating dynasties.
Any evidence to support these statements? I give you Nobel Laureate Gunnar Myrdal (Asian Drama) who singled out the Philippines thusly: “Graft and corruption permeate all levels of public life.” And even more painful: “…Perhaps in no other country in South Asia is political dishonesty so widely recognized, accepted and talked about as a part of the political game….” This, in 1968.
Thirty-five years later (I told you, this is a long view), in 2003, the World Economic Forum conducted an Executive Opinion Survey in which the countries surveyed were classified as: low corruption, moderate corruption, and high corruption. The Philippines was one among 10 countries in the last category—and the only Asian country at that. The other comparator countries were all “moderately corrupt.”
In other words, Reader, we were unique—in corruption. And it is not a question of eradicating, just moderating, for now.
What about the effect of political dynasties? That, too, has been studied. And the conclusions are that the presence of these dynasties is correlated with higher poverty, lower per capita income, and lower primary education completion rates. And how pernicious are these dynasties? The Asian Institute of Management estimates (2012) that they accounted for 70 percent of regular legislators in the Congress at that time.
The costs of corruption are not limited to low growth rates and per capita income. They affect development indicators, too.
But on the bright side, some improvement has come since 2009. Data on the Corruption Perceptions Index for 2010-2015 indicate that the Philippines has risen from 139th out of 180 countries in 2009 to 102nd out of 180 in 2015. The pcgdp growth rates for the last five years averaged 4 percent a year. And health, education, and long-term antipoverty prospects are great.
So, Reader, if you want things to get better, use your vote wisely. It may help to know that two of the presidential candidates and three of the vice presidential candidates are dynastic. That should make our choices easier.
RELATED STORIES
Winnie Monsod: Congress sustains evil of feudalistic economy


