Education, location, poverty

COLLEGE students arrive at Quirino Grandstand in Rizal Park, Manila, to attend a Mass. NIÑO JESUS ORBETA
The government in April reported a drop in the percentage of poor people in the country from 27.9 percent in 2012 to 24.9 percent in 2013. While the gain may seem modest, this was noteworthy, considering poverty incidence practically stalled from 1997 to 2012—a 15-year period that saw the presidency change hands three times and when per capita gross domestic product (GDP) growth averaged a reasonably good 2.4 percent per year.
Why has economic growth, which has outstripped population growth, not made much of a dent in our poverty? Why have our Southeast Asian neighbors succeeded in bringing poverty incidence down to single-digit levels or even to zero?
One reason, as others have noted, is that our economic growth has not been sustained long enough. In contrast, economic growth in our more successful neighbors, like Malaysia and Thailand, has been more or less sustained over several decades.
Another reason is the character of our economic growth. From 1997 to 2012, the agricultural sector grew at an annual pace of only 2.6 percent—barely higher than population growth. Industry grew slightly faster at 3.4 percent per year.
Mostly in agriculture
Most of the poor are in agriculture. Had industrial growth been higher, it could have been more easily shared by the low-skilled and poor. Rather, it was the services sector that dominated growth, expanding by 5.3 percent per year over the period.
Within services, it was higher-end services like business process outsourcing and finance that led growth. This type of growth favors urban centers and people who possess higher skills and educational attainment. As we will show later, many of the poor are poorly positioned to benefit from the growth.
Trapped
Families may be trapped in poverty if they are unable to increase the human capital of their members and realize increased real return to it. A family’s income is determined by the productive capacity of its members and the value of their output.
In turn, these depend on the state of development of their location and where they are employed—whether in the formal or informal sector, government or private, and large- or small-scale firm.
In less-developed economies with inadequate and unequally distributed infrastructure and social services, like the Philippines, the productivity of human and physical capital varies across locations depending on their development—whether they have adequate transport and communications infrastructure, good water and irrigation systems, and whether they are provided with basic social services, such as education, healthcare and legal protection.
Location, poverty
Poverty is still largely concentrated in rural areas—poverty incidence is more than three times higher in rural than in urban areas. In 2009, 78 percent of the poor lived in rural barangays. Poverty incidence is in single-digit levels in the urban areas of more developed regions, specifically Metro Manila, Cordillera Administrative Region (where Baguio City is), Central Luzon, Calabarzon and Western Visayas (where Cebu City is).
On the other hand, poverty is consistently high in the rural areas of regions frequently struck by natural disasters, like the Bicol region and Eastern Visayas, areas with long-standing political conflict like the Autonomous Region in Muslim Mindanao (ARMM) and Region 9, and areas like Caraga and Mimaropa, which are otherwise underdeveloped and isolated from large markets for goods and services.
Natural disasters and political conflict are similar in that they hinder investments, the buildup of infrastructure and the creation of more productive employment.
Human capital, poverty
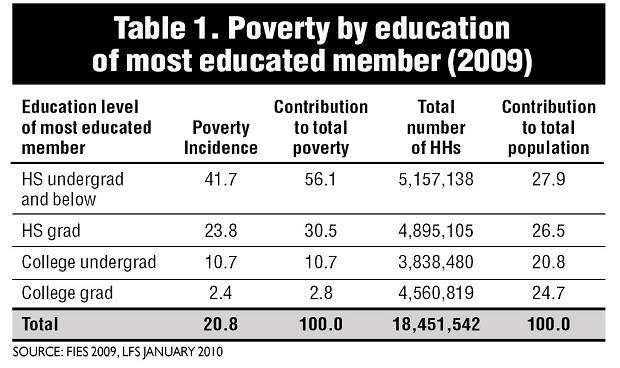
Table 1 shows the link between poverty and the household human capital in 2009. Here, the human capital is measured by the education level of the most educated adult (18 years old and above) household member. Poverty incidence is 41.7 percent for households with at most adult high school undergraduates.
Poverty incidence drops to 23.8 percent for households with at least one adult high school graduate. This drops even more steeply to only 10.7 percent for households with an adult college undergraduate and to only 2.4 percent for households with an adult college graduate. (See Table 1.)
Households with at most an adult high school undergraduate comprise only 28 percent of the total households but make up 56 percent of total poor households. Households with at least one college undergraduate or college graduate, on the other hand, comprise 46 percent of total households but contribute only 14 percent to total poor households. We do not show the tables here, but this pattern has been consistent over time.
Professional jobs
Education determines the probability of finding employment in the more attractive formal enterprises, in the government bureaucracy and even overseas. College graduates qualify for professional jobs and the high school-educated qualify for many blue collar jobs in various industries.
They are covered by the minimum wage and other protective labor laws. The minimum wage approximates the poverty line so that those who find employment in the formal sector typically escape poverty.
The less educated have a smaller probability of employment in the formal sector. Formal sector jobs are concentrated in the larger cities and these attract workers from less developed areas. Younger and more educated and skilled workers migrate for they have a higher probability of landing formal jobs.
Fairly high internal migration rate has occurred toward the more progressive and large regions, such as Metro Manila, Central Luzon, Calabarzon and Central Visayas where Cebu, the second largest city, is located.
Interconnections
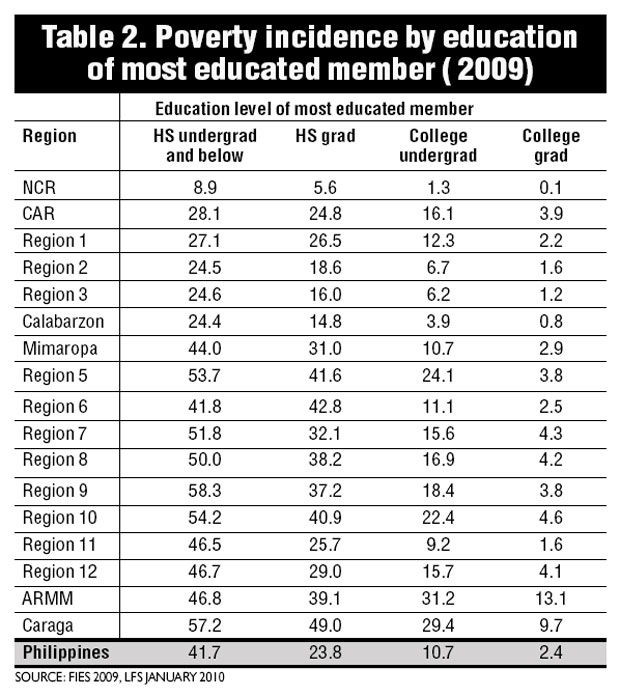
As earlier stated, the return to human capital depends on the state of development of its location. Table 2, which shows poverty incidence by region and by education level, illustrates this. In general, poverty rate falls as the education level of the household increases but the effect of education on poverty varies significantly across regions.
In the more developed regions—Central Luzon, Metro Manila and Calabarzon—the poverty rate of families with less than complete secondary education is lower than that in the other regions. In fact, in these regions, the poverty incidence for households with only complete secondary education is below the national average.
Conflict-ridden
Contrast this with conflict-ridden ARMM where poverty incidence for college graduate households is double digit (13.1 percent) and for college undergraduate households a high 31.2 percent—much higher than the national poverty incidence.
The Bicol region in Luzon and Eastern Visayas are examples of disaster-prone regions where poverty falls more slowly across education levels of households compared with other regions. (See Table 2.)
The human capital of the household comprises not just the most educated member but rather all its members, especially the adults. On average, there were 2.8 adults in poor households in 2009 and 3 adults in nonpoor households.
Of the 2.8 adults in a poor household, on average, 1.6 (58 percent) completed primary schooling at most, one (35 percent) either reached or completed secondary schooling and the remaining 0.2 (7 percent) reached college.
In contrast, in a nonpoor household, of the 3 adults, only 0.8 (26 percent) completed primary schooling at the most, 1.1 (38 percent) reached or completed high school and 1.1 (36 percent) reached or completed college. The average number of college graduates in poor households is close to nil, whereas in nonpoor households it is 0.5.
Intergenerational
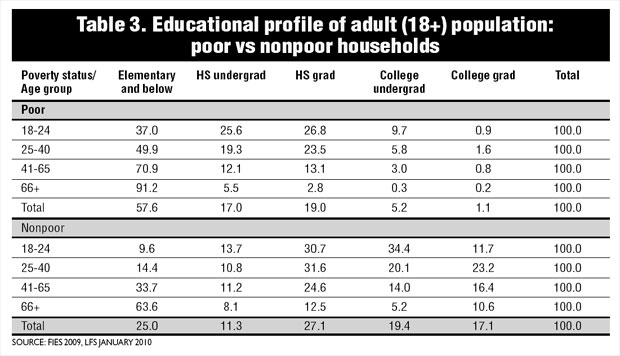
One may also look at the educational profile of the adult population by age group to see whether among the poor, educational attainment has improved for the younger cohorts.
Table 3 provides evidence that, in fact, such improvement has occurred although relatively slowly. Among those over age 65, only half a percent of adults in poor households reached at least incomplete tertiary. This goes up to 4 percent for those 41-65 years of age, 7.4 percent for those 25-40 and 11 percent for those 18-24.
Contrast these with nonpoor, where the share of those who reached at least incomplete tertiary was high for all adults. The gap in college graduates between poor and nonpoor households is wide—23 percent college graduates among the 25-40 in nonpoor households and only 1.6 percent in poor households. Nonpoor households with high human capital and offshoots from these households can be expected to remain nonpoor. (See Table 3.)
Chronic
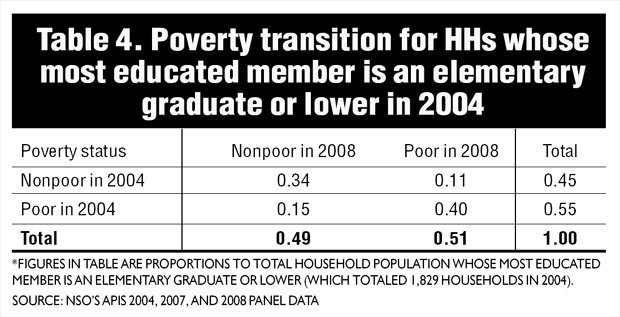
Using panel data from 2004 to 2008, consisting of 7,574 households tracked by the National Statistics Office in its Annual Poverty Indicators Surveys for 2004 and 2008, the link between lack of human capital and chronic poverty can be seen even more clearly.
Table 4 shows the poverty transition matrix for elementary graduate or undergraduate households in 2004. The table shows that 40 percent of such households were chronically poor (or poor in both 2004 and 2008), 15 percent were poor only in 2004, and 11 percent were poor only in 2008.
If one divides the share of the chronic poor by the baseline share of the total poor, we get a proportion of the poor who remained poor. For these households, the share of the poor in 2004 who remained poor in 2008 was 72.7 percent (40 divided by 55).
These findings lead us to ask why there are so many households with low human capital and why there is a very large difference in average income and poverty rate between regions. The government has tried to establish elementary schools in all municipalities and villages.
High school is highly subsidized directly through the public high school system and the voucher for tuition in private high schools for students who could not be accommodated in existing public high schools. Yet, more than 10 percent of primary grade children are not enrolled and the participation rate in high school is less than 70 percent.
Remote areas are not reached by reasonably priced transport and little is done for improving the productivity of their agriculture, fishing and other activities. These areas are segmented from the main markets and they tend to face lower prices for their outputs, and higher prices for goods and social services produced in distant leading cities.
The poor in these areas are too poor to finance migration to areas with better employment opportunities beside the fact that they have no qualifications for available jobs. Most factory jobs in large enterprises require high school education.
Transport system
The foregoing analysis calls for developing strategies that would address the geographic isolation of areas where serious poverty has persisted. Offhand, they need good transport system that would link them to the nearest central cities, access to information on and supply of productivity-enhancing technologies for their livelihood, whether agriculture, fishing or tourism, and access to good-quality high school education.
These would raise the productivity of their labor and resources and allow them to acquire human capital and capacity to migrate. The goal of reducing income poverty and other deprivations would be difficult to achieve without addressing the inequality of social and economic development of rural areas, especially the remote ones.
(The authors are assistant professor and professor emeritus, respectively, at the University of the Philippines School of Economics. This article is culled from their joint paper “Who are the poor and do they remain poor?” downloadable at www.econ.upd.edu.ph.)


