There is a rare mix of pain and pleasure in the new Social Weather Stations (SWS) poverty report, titled “Second Quarter 2024 Social Weather Survey: 58% of Filipino families feel Poor, up from 46% in March 2024,” and subtitled “30% Not Poor ties December 2014 record high; 12% Borderline ties February 1992 record low,” www.sws.org.ph, 7/18/2024.
Poverty continues to be volatile. Primary concern should go to the 12-point jump in the percentage of families feeling Mahirap or Poor, between March and June. Coming from surveys with the usual 3-point error margin, so large a jump is not a sampling blip. It was 16 years ago, in 2008, that Self-Rated Poverty (SRP) was last as high as it is now.
SRP has ranged between 74 percent in July 1985 and 38 percent in March 2019, in 143 national surveys done since 1983. In successive surveys, it has had leaps of 19 points (1983-1985) and 16 points (twice, in 1987-88 and in 2019). It has also had large drops of 24 points (1986-87) and 12 points (2018-19).Families Not-Poor also fluctuate significantly. At the same time, there was a favorable 7-point rise in the percentage of household heads rating their families Not Poor (Hindi Mahirap), from 23 last March to 30 in June, which now matches the record high set 10 years ago. This suggests that, together with the usual failure of economic growth to trickle down, this time there was also some amount of trickle-up. This has happened before: in 1990, 1992, 1999, 2000, 2003, 2012 (twice), 2017, and 2019.
The Borderline families are a class in themselves. There are 12 percent of families who now see themselves on a line between Poor and Not Poor. This 12 percent is a massive 18-point dive from 30 percent last March, and now matches its record low from 32 years ago.
Thus, the biggest change in the second quarter of 2024 is the drop in the Borderline percentage, due mainly to many families falling into poverty, and secondarily to some families rising above it.
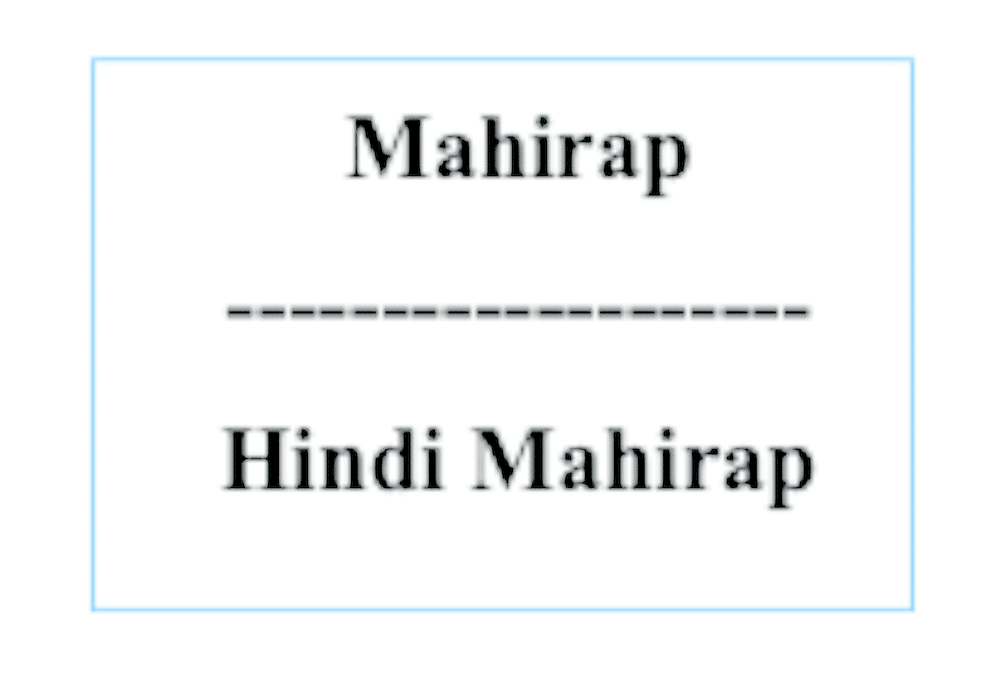
The three divisions of Poor, Borderline, and Not Poor are real. Their relevance to the people is an important discovery of the bottom-up approach. To minimize prompting, the survey probe only uses the word Poor and its negative, Not Poor. These words are not spoken by the interviewer but are written on a card, separated by a line (see above), that is shown to the respondent, who is then simply asked: “On this card, please point to where your family is.”Survey interviewers are trained to record any response, without dispute; “no answer” and “refused to answer” are standard for them. We did not expect, long ago, that so many would point to the borderline. In any case, following best survey practices, all responses are recorded.Geography. The SWS surveys are designed to obtain data for the National Capital Region (NCR), Balance Luzon, Visayas, and Mindanao—listed in the latest reverse order of poverty. Sometimes Visayas has a higher poverty rate than Mindanao. Rarely does Balance Luzon have less poverty than NCR. The latest national trend is mirrored in the area trends, with the Borderline likewise shedding size in favor of both the Poor and the Not-Poor. Interestingly, the Not-Poor exceed the Poor in NCR as of June; it also did in March. Whereas, in other areas, it is still the Poor that dominate.
Self-Rated Food Poverty. This is monitored with the same show card as Self-Rated Poverty, except that the interviewer asks the respondent to point to where the family is on the card with respect to the quality of its food. The new survey found a 13-point rise in the percentage of Food-Poor and also an 8-point rise in the percentage Not Food-Poor, coupled with a 21-point decline in the percentage on the Food Borderline.
Self-Rated Poverty Thresholds and Poverty Gaps. Those rating themselves Poor are asked how much monthly home expense budget they need (the threshold) in order to not feel Poor, and afterward how much they lack (the gap) to reach it. These vary from area to area in line with local living costs.
In NCR as of June, the median threshold (i.e., applicable to half of the poor) is P20,000, and the median gap is P6,000. For the nation as a whole, the median threshold is P15,000, and the median gap is P6,000. I think these modest numbers show that the scale of bottom-up poverty is realistic, and not due to the people’s exaggerations of their needs.
To understand the dynamics of poverty, there is no substitute for repeated quantitative monitoring. The only quarterly statistics on Philippine poverty happen to be those of SWS; these are addressed to all interested parties, private or public, domestic or foreign. Incorporating them in econometric forecasting models, together with other economic time series, will introduce a vital element of economic well-being to such models.
Over the past four decades, the largest group has generally been the Poor, the middle-sized has been the Borderline, and the smallest has been the Not Poor. With more analysis of the data, how can this order be reversed?
—————-
Contact: mahar.mangahas@sws.org.ph.

