Setback on hunger

The new Social Weather Stations (SWS) hunger rate, at 12.6 percent of all families nationwide, is the highest of the four quarters of 2023 (see “Fourth Quarter 2023 Social Weather Survey: Hunger rises from 9.8% in September to 12.6% in December 2023,” www.sws.org.ph, 1/22/24).
The latest quarterly hunger rate was the highest since September 2021. It lifted the 2023 average to 10.7, which is an improvement from the 2022 average of 11.7. Yet, if it had simply stayed the same as in the previous quarter, then the 2023 average would have gone to 9.9, in single-digit land, like in pre-pandemic 2019 when the average was 9.3.
SWS has done 104 surveys of hunger so far. SWS’ primary mission is to monitor human well-being over time. When surveyed for the first time in July 1998, hunger turned out to be 8.9 percent of families nationwide—which was mild, in retrospect, but seemed so high that SWS kept it on its agenda since then.
From 1998 to date, the percentage of families saying they experienced hunger (with nothing to eat, i.e., making the hunger involuntary rather than the consequence of voluntary dieting) at least once in the previous three months has ranged between 5.1 (September 2003), and 30.7 (September 2020). The survey respondents also say if it happened only once, a few times, often, or always (minsan lamang, mga ilang beses, madalas, o palagi); the first two responses we call “moderate” hunger; the last two we call “severe” hunger.
The new rate of 12.6 percent consists of 11.2 percent moderate (which rose by 2.8 from the previous round) and 1.4 percent severe (which rose by only 0.1). Every hunger report has the entire history of hunger rates, divided into moderate and severe, since 1998.
But in the capital the change was favorable. The good news is that hunger fell by 4.6 points in the National Capital Region (NCR). The setbacks of the fourth quarter happened in Mindanao (by 5.3 points), Balance Luzon (by 4.0), and Visayas (by 2.6). As a result, the new hunger rate consisted of 14.3 percent in Balance Luzon, 12.7 percent in the National Capital Region (NCR), 12.0 in Mindanao, and 9.3 in Visayas. Thus, NCR dropped to second-hungriest last December.
Nevertheless, for 2023 as a whole, NCR still had the highest average hunger (14.1 percent of households). Next came Balance Luzon (11.2), Mindanao (9.2), and Visayas (8.8). Every report has the hunger survey history for each area; it is for regional development experts to analyze. NCR also had the worst hunger averages in 2022 and 2021.
The interaction of hunger and poverty changes over time. Hunger rates are generally higher in the North, even though poverty rates are generally higher in the South. For the recent relief from hunger in the North, i.e., in NCR, there was a counterpart relief from poverty in Mindanao (see my “Poverty: the latest reminder,” 1/20/24).
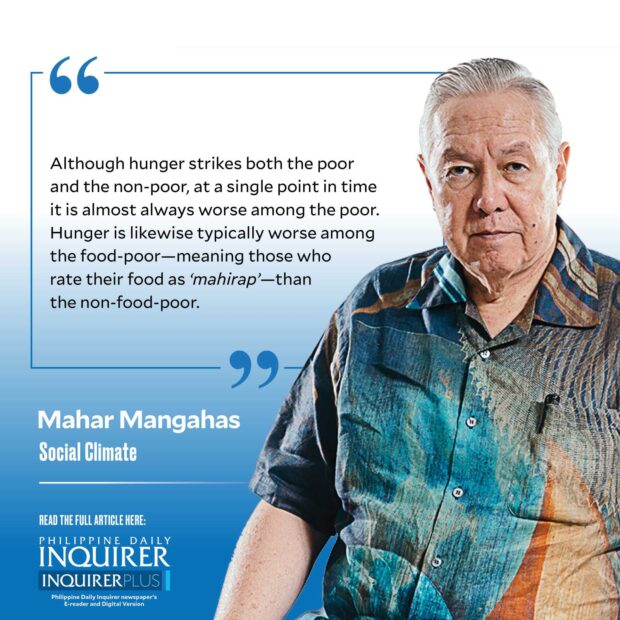
Although hunger strikes both the poor and the non-poor, at a single point in time it is almost always worse among the poor. Hunger is likewise typically worse among the food-poor—meaning those who rate their food as mahirap—than the non-food-poor.
Across time, however, there are fluctuations in the hunger rates of both the poor and the non-poor. Such fluctuations lead, every so often, to opposite movements in hunger and poverty. This is an important discovery enabled by the regular quarterly surveying of hunger together with poverty. (Incidentally, the survey respondent is the household head. The interview always begins with questions about poverty and food poverty; then it proceeds to questions about hunger.)
In December 2023, a staggering 20.1 percent of poor households and 25.5 percent of food-poor households had experienced hunger recently. On the other hand, only 5.9 percent of the non-poor and 6.5 percent of the non-food-poor had gone hungry. These combined for the recent 12.6 percent national hunger rate.
The previous September, however, hunger was only 7.7 percent among the poor, and 7.0 percent among the food-poor. Those rates were unusually below the 10.4 percent hunger among the non-poor and 11.0 percent among the non-food-poor. They accounted for the 9.8 percent national hunger rate in September.
It is time to engage in quarterly forecasting of self-rated poverty and hunger by means of econometric models. The many decades of quarterly surveys have produced enough time series for constructing models of change. Initial work shows inflation, especially in food prices, to be the strongest determinant.
The change in unemployment seems the second strongest. On the other hand, there is no significant association between the change in gross domestic product as a whole or in GDP sectors and the change in poverty.
There is no restriction on using SWS data. All researchers from academia, government, business, and elsewhere are welcome to seek knowledge of what the future has in store for the well-being of the Filipino people.
Contact: mahar.mangahas@sws.org.ph.


