


Social classes seen from below


Self-Identified social class. In April-May of that year, SWS conducted the Philippine round of the 2019 survey on Social Inequality of the International Social Survey Program (ISSP). One of its questions asks what social class the respondent personally belongs to, from a list of six classes. This reveals the social classes as seen from below, just as Self-Rated Poverty is poverty as seen from below.
As implemented by SWS, the social classes are stated in the following way, with no further explanation: (a) Mababang antas ng lipunan o Lower Class; (b) Grupo ng manggagawa o Working Class; (c) Mababang antas ng kalagitnaang antas ng lipunan o Lower Middle Class; (d) Kalagitnaang antas ng lipunan o Middle Class; (e) Mataas na antas ng kalagitnaang antas ng lipunan o Upper Middle Class; and (f) Mataas na antas ng lipunan o Upper Class.
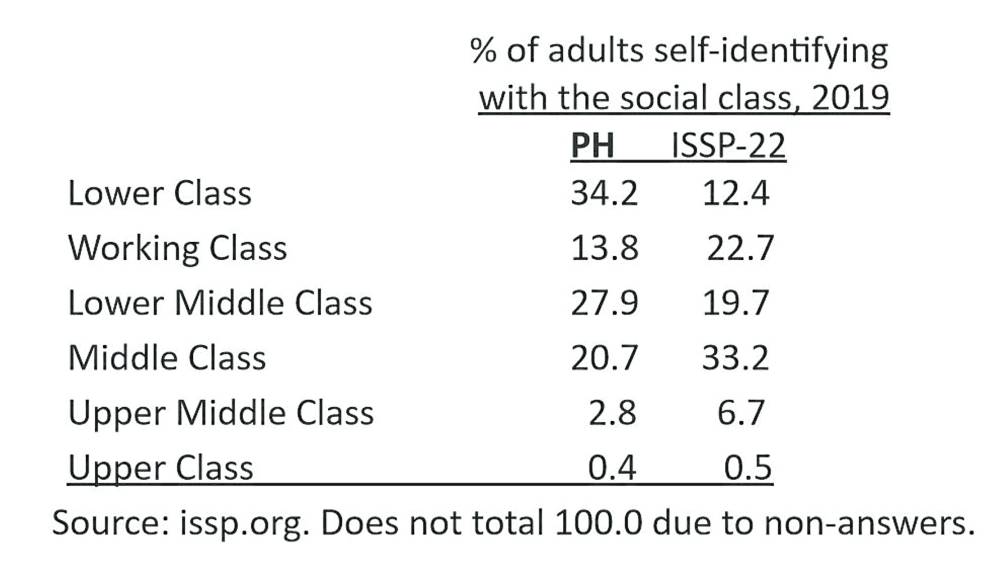
The English versions are as agreed by the ISSP members, by majority vote; the translations are the responsibility of each country-member (this survey was done in 22 countries). In implementing this item, SWS decided to join the Filipino and English versions, instead of using the Filipino version only. The results for the Philippines (PH) and the average of the 22 countries that did the survey were:
The other countries were Bulgaria, Chile, Croatia, Czechia, Denmark, Finland, Germany, Great Britain (presumably without Northern Ireland), Iceland, Israel, Italy, Japan, Lithuania, New Zealand, Russia, Slovenia, South Africa, Surinam, Switzerland, Thailand, and Taiwan. The country composition is not fixed—a country may lack survey funds; the Chinese member needs government approval to survey each topic.
The Philippines’ 34.2 percent self-identified Lower Class is the second-highest of the 22 countries, after South Africa’s 43.2 percent. Our Upper Class of 0.4 percent is below average, but above Thailand’s 0.1 percent and South Africa’s 0.0 percent. All ISSP data are free to the public via its website.
I consider the ISSP social classes as the most practical for general research, because they are open to the public, and periodically updated, with the questions strictly unchanged. When done in the Philippines in 1999, the class-percentages, starting from below, were: 31.9, 13.8, 10.8, 37.7, 2.2, and 1.0. This shows that our Middle Class shrunk by 17 points, while our Lower Middle Class grew by 17 points, over two decades.
The meaning of each “social class” is whatever the survey respondents understand by its description. In British English—the official ISSP language—the term “working class” is a category between lower class and lower middle class. SWS implements it by showing respondents the full range of answers to choose from.
Society depicted by stacked blocks. The ISSP has another way of asking about social classes by showing the respondents five diagrams of stacked blocks, each block representing a group of people, and describing the diagrams thus:
“Type A: A small elite at the top, very few people in the middle, and the great mass of people at the bottom;
“Type B: A society like a pyramid with a small elite at the top, more people in the middle, and most at the bottom;
“Type C: A pyramid except that just a few people are at the bottom;
“Type D: A society with most people in the middle; and
“Type E: Many people near the top, and only a few near the bottom.”
Then the interviewer says: “Read the descriptions and look at the diagrams and decide which you think best describes your country.” Thus, this item is on how the people judge the structure of their society, rather than on where they see their own place in it. Types A and B are relatively elitist structures, whereas Types D and E are relatively egalitarian.
When surveyed by SWS for ISSP in 1999, the percentage results of this item were: Type A, 26; Type B, 28; Type C, 11; Type D, 20; and Type E, 12. This means that 54 percent of Filipinos saw society as elitist, while 32 percent saw it as egalitarian, two decades ago.
On the other hand, when surveyed in pre-pandemic 2019, the percentage results were: Type A, 31; Type B, 42; Type C, 11; Type D, 10; and Type D, 6. This shows 73 percent of Filipinos now seeing society as elitist, versus 16 percent seeing it as egalitarian.
As seen from below, even though absolute poverty has declined (more or less, since the decline has not been smooth), the Philippine social structure has grown more elitist and less egalitarian.
——————
Contact: mahar.mangahas@sws.org.ph


