


The Real Price of Electricity in the Philippines, 2018-2029


Antonio A. Ver
In this episode of the national conversation, the focus is on pricing and on a few areas that affect electricity pricing considering revenues, costs, profits, and related perspectives. The time frame for source data is 2006-2017, (2006=100) and (2012=100).
I. Revenues
It is the final consumer who ultimately shoulders three costs: distribution, transmission, and power generation. What he pays are reflected in the electricity price index. Based on the Philippine Statistical Authority (PSA) survey, 4.800195% or more than 1/25 of all household expenditures in the Philippines go to electricity.
During the period under review, the EPI can be seen to move up and down around the 120.32 average, from 96.2 in January 2006 to 133.7 in December 2017. Thus, its estimated growth is about 38.98% for those 12 years, or 3.25% yearly. Therefore, it can be said that the industry revenues are increasing by 3.25%, to be collected way after the electricity is delivered and used.
II. Costs
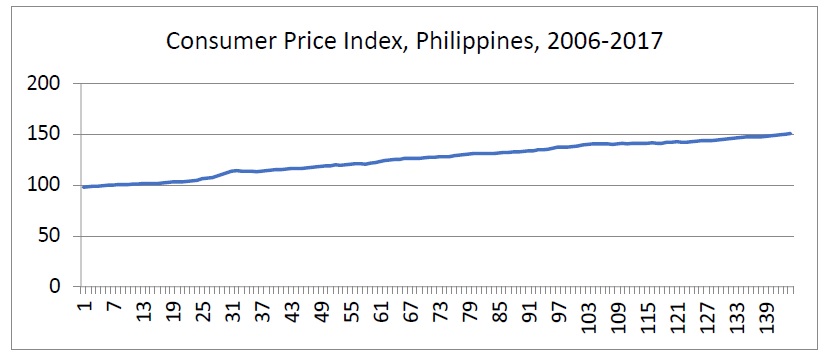
While revenues are rising, the costs are also rising, more steadily in fact, as shown below in the graph of the Consumer Price Index (CPI)- Philippines-All Items, the overarching measure of CPI. It is based on a fixed basket of goods and services, several hundreds of them. There is a sub-CPI for Electricity, Water, Gas and Other Fuels. Moreover, there is the electricity price index (EPI).
Continuation of the “Policy Framework for the Electric Power Industry of the Philippines’ NIC-hood: Quo Vadis?” INQUIRER.net, November 19, 2018/.
President & CEO, H&WB Asia Pacific (Pte Ltd) Corp.www.hwbasiapacific.net, and Chairman of Power Marketplace & Exchange Corp. (“PMEx”), www.PMEx.ph.
As the table below indicates, the growth rate of the CPI is higher than the growth rate of the EPI. Its estimated growth is about 54% for those 12 years, or 4.5% yearly. Therefore, it can be said that the increase in industry costs is higher than industry revenues by 1.25%, to be paid in advance before any electricity can be generated.
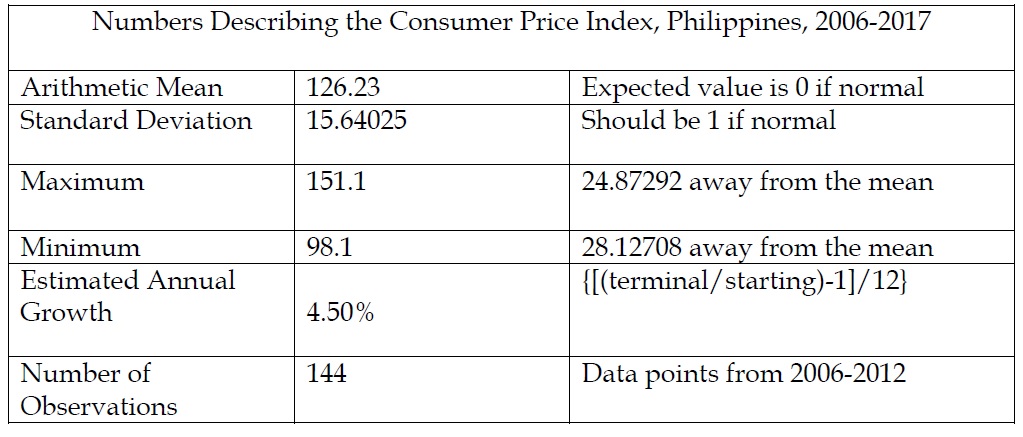
During the period under review, the CPI can be seen to move up and down around the 126.23 average, from 98.1 in January 2006 to 148.6 in December 2017. Thus, its estimated growth is about 54.03% for those 12 years, or 4.5% yearly. Therefore, it can be said that the industry costs are increasing by 4.5%, to be collected way after the electricity is delivered and used.
With electricity included in the CPI basket, logically, electricity prices underperformed the rest of the selection in the market basket. (Infra. Revenues). Essentially, this can indicate loss of economic power of the players in the electricity business. (Supra. Profits).
III. Profits
Without looking directly at the financials of individual firms, one can infer what kind of profits the electricity players are making by looking at the rate-of-return base (RORB).
Return on rate base (RORB) is an accepted regular pricing method used by utilities worldwide. Under this method, the utility firm is allowed to set a price that makes possible a specified level of profits that is called the rate of return base. It involves presenting proof of the value of assets used in the business, in which the RORB is based.
In the Philippines, the rate of return base is often mentioned as 12%. This means that the utility firm is allowed to make up to 12% in profits, based on the assets used in the business.
On May 5, 1993, Executive Order No. 86 adjusted the rate of return base (profits) of the National Power Corporation (NAPOCOR) from 10% to 12%. Of course, the 12% is to be understood as a maximum allowable limit beyond the pale of government intervention. But, the EO specifically mentioned only NAPOCOR. Yet, rightly or wrongly, the 12% has gained traction in the minds of many.
However, the reality is that the RORB trend is downward, buttressing the suspicion that the economic power of the players in the electricity is indeed slipping away from their hands. (Infra. Revenues).
In a recent decision, a RORB of 10.37% in a Power Supply Agreement is what the Energy Regulatory Commission allows the petitioner to make, after finding out that its capitalization is formed out of 27.5% borrowed money and 72.5% equity. Since the lenders of the 27.5% charge only 5.5%; thus, the ERC ruling says that the equity owners are entitled only to about 12.23% return. In sum, the firm’s allowable RORB is only 10.37%.
In the given example, 72.5% debt at 5.5% and 27.5% equity at 12.23% results in an RORB of only 7.3508%. But, that is getting ahead in the discussion. (Supra).
Out of necessity, the RORB is there to allow the power generation business to pay its lenders on time. To safeguard the public interest, a periodic triennial review of assets forms part of the oversight protocol on RORB.
To make 10% after taxes, a firm has to make 15% before taxes. To pay 5% interest on, say, 70% of its capital, to settle its expenses, and to pay its dollar obligations to raw materials suppliers means that the firm has to set its gross margin at about 20%. Lower than that, the required rate of return may not be met, sending a signal that it is better to be in another business.
Recall that the EPI (3.25 %) growth rate is lower than that of the CPI (4.5%), within the period from 2006-2017. This means that cost increases are way above revenue increases during the period. Yet always, debt amortization covenants need to be honored.
Through the years, the RORB continues to evolve to benefit the consumer, while serving as a safety net against increasing prices. While technically it is a return on assets, its interpretation now is closer to return on equity.
IV. Factors Affecting After-tax Profits
A. Fisher Effect Hypothesis
When borrowing money from a lending institution, the client knows that apart from the quoted interest, he must pay for other charges like the service charge. The
borrower also knows that the longer the lender must wait to get his money back, then, the borrower must pay a higher rate than if the waiting time were shorter.
The reason being the pricing of the loan, or interest rate, is subject to the Fisher effect (Irving Fisher, 1930), arising directly from the so-called Fisher equation, to wit, interestnominal= interestreal + inflation expectations, which is the template for all equations in finance.
In a nutshell, the Fisher equation says that the interest rate embodies two important components: the price of risk and, the price of time. (Stephen Ross, Corporate Finance). And, so it is with the pricing of electricity: there is a price of risk and the price of time.
Considering that a considerable portion of the capitalization of a power plant is borrowed funds, therefore, the power generation industry is subject to the Fisher effect. Therefore, the price paid by final consumers contains two important components: the price of time and the price of risk, viz., on hindsight, pricenominal = pricereal + inflationactual. Therefore, pricereal = pricenominal – inflationactual. Applied to electricity prices, the real price is equal to the nominal (quoted) price less inflation. Thus, after deducting inflation from the final price already paid by the consumer, what is left is the real price of electricity, on hindsight. However, on foresight or before the fact, inflation expectations are but conjectures.
By definition, inflation refers to the percentage change in the consumer price index (CPI) over a given period, usually, one year. (Supra. The Real Price of Electricity).
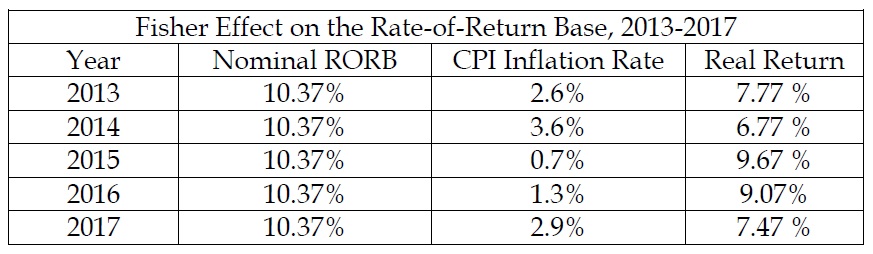
The table shows the Fisher effect on the putative maximum RORB of 10.37%. (Supra. Profits). Only figures duly admitted by the PSA are reflected in the table. That explains why only 2013-2017 are included in the table.
Nevertheless, the table is sufficient to illustrate that the effect of inflation on the rate of return is to erode it, irrespective of what are included as part of the rate base.
B. The Real Price of Electricity
This is simply a comparison (Chart III) of the electricity price index at a given time as against the electricity price index value at the same month a year ago. Hence, in technical terms, it is an independent depiction that is true only for months that are exactly one year apart: nothing more, nothing less. (Infra. Fisher Effect Hypothesis).
To make sense of the information, the EPI inflation rate can be compared against the CPI inflation rate. The findings indicate that out of 144 months, there were 34 months that the EPI inflation rate exceeded the CPI inflation rate, two times that they were equal, and 108 times that the EPI inflation rate was lower than the CPI inflation rate. In the graph below, all observations below the zero line denote the 108 instances when the EPI inflation rate fell below the CPI inflation rate, while those above the zero line denotes the 34 times that the EPI inflation rate was higher than the CPI inflation rate. At only twice are when their year-to-year changes the same.

To test the statistical significance of this, one can perform a chi-square test. This leads to the conclusion this is statistically significant at 95% level of confidence (critical value=3.841).
Since the chi-square is also a test of normality, the test can also conclude that the arithmetic differences between the EPI and the CPI from 2006-2017 are not normal and constitute a statistical pattern: the EPI changes fall behind the CPI inflation rate. Recall the Fisher equation where the reward for capital is equal to the real return to capital less inflation. In no uncertain terms, the real return to the investors in the electricity business is falling from 2006-2017.
C. The Purchasing Power of the Peso
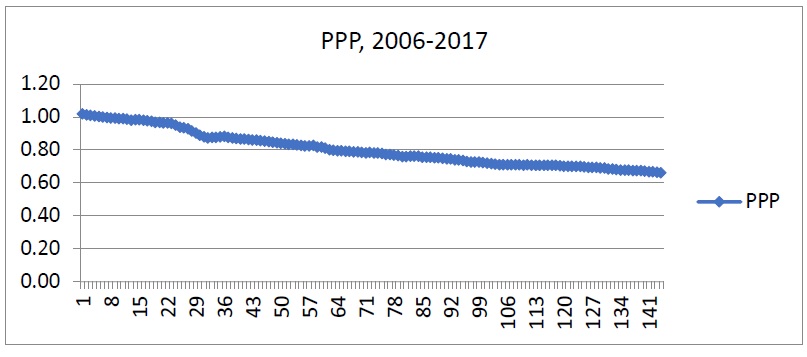
In linear form, the graph above depicts the purchasing power of the peso from 2006- 2017.
The purchasing power of the earned Peso is just the number 100 multiplied by reciprocal or multiplicative inverse of the CPI. This means that the purchasing power of the Peso goes south when the CPI goes north. And since the graph shows a rising CPI from 2006-2017; therefore, the purchasing power of the Peso is going in the other direction.
In more specific terms, a CPI (2006=100) of 151.1 in December 2018 means that that the purchasing power of the Peso has fallen to 66.23 centavos since 2006, as computed from 100/151, where the dividend is .662252.
V. Disclosures
A. The Gordon model
The mathematics of the Gordon model, that is, dividing the last monthly EPI by the earliest monthly EPI then deducting 1 from the quotient is the shortcut used to compute for the growth rate for 2006-2017. The result is the same as that of the Laspeyres formula, which the PSA uses to determine the inflation rate.
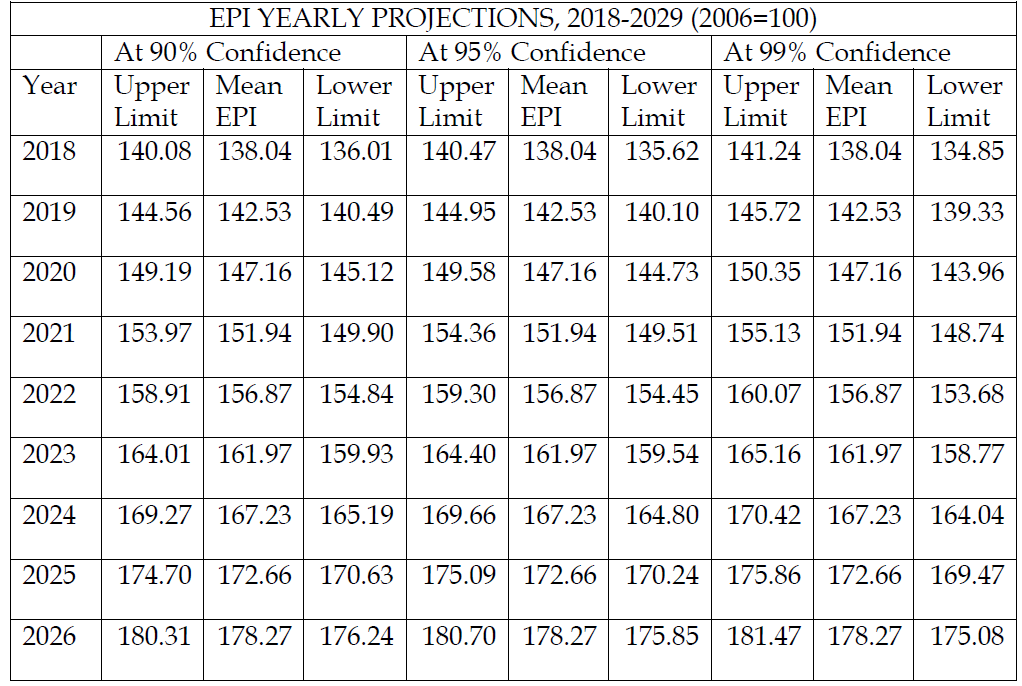
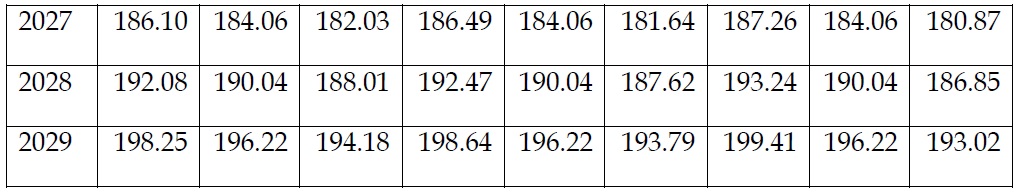
B. Projections for 2018-2029
In tabular form, the yearly projections for 2018-2029 are given below.
C. Back-testing the EPI Projections
When the (2006=100) series was discontinued after June, the EPI growing average is 139.78 for 2018, based on Table V below.

In conclusion, the yearly average hypothesis works well for the electricity price index.
D. Forecasting EPI for December 2018
Using the above table, the December 2018 forecast with its upper and lower limits at the 90%, 95%, and 99% confidence intervals are boxed in the table below. The growth rate is .2707% a month.
The mean EPI (2006=100) forecast for December 2018 is 144.22. The 90% confidence interval is 138.46-149.98. The 95% confidence interval is 137.36-151.08. At the 99% confidence interval, it can go as low as 135.19 or as high as 153.25. The growing 12- month average for 2018 is 141.5. Using the above projections of the (2006=100) series, they imply that the inflation rate in December 2018 is 7.9%.
A newly-rebased EPI (2012=100) is now available. The new series runs from January 2012 through November 2018. It has 88 entries with an average of 98.4 and a standard deviation of 4.670288. Out of necessity, the EPI projection for December 2018 (2012=100) comes from these 88 EPI values, which eliminated the “black swan” years from 2006-2011.
The forecasting procedure stands on the Efficient Market Hypothesis (EMH) of Nobel laureate Eugene Fama which holds that available information drives prices and therefore prices reflect all available information at the time. Thus, the most recent available electricity price is the starting point for projection subject to change as more new information arrives. (Fama, 1967).
Using all the 88 rebased EPI values appearing on the PSA website as (2012=100), the mean EPI forecast generated for December 2018 is 102.98. The upper and lower limits depend on the error or level of significance that the reader accepts.
At the 90% confidence interval, it can go from 102.18 to 103.77. At the 95% confidence interval, it can go from 102.03 to 103.92. At the 99% confidence interval, it can go from
101.73 to 104.77. All the aforementioned figures are contained in the table below.
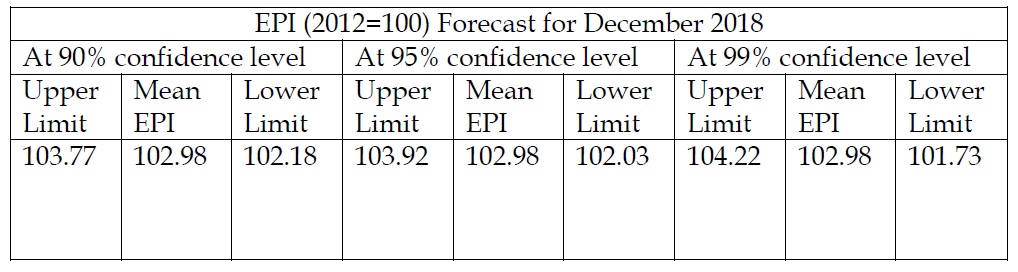
Consequently, the EPI average index for the year is 101.5 and the implied December inflation rate is 7%, after applying .002707 monthly growth on the (2012=100) November EPI.
A. The Moving Average Framework
The moving average (MA) hypothesis is supposed to be useful in detecting bull runs or good times, and bear runs or bad times using the Moving Average Convergence- Divergence theory. Accordingly, when the MA for 20 periods is greater than the MA for 10 periods, which in turn is higher than the MA for 5 periods, then the market is experiencing good times (bull run) in prices. Using (2006=100) data, the electricity market is going through good times at the end of December 2017, for the simple reason that electricity prices are recovering after being left behind by the other items in the consumers’ expenditure list.
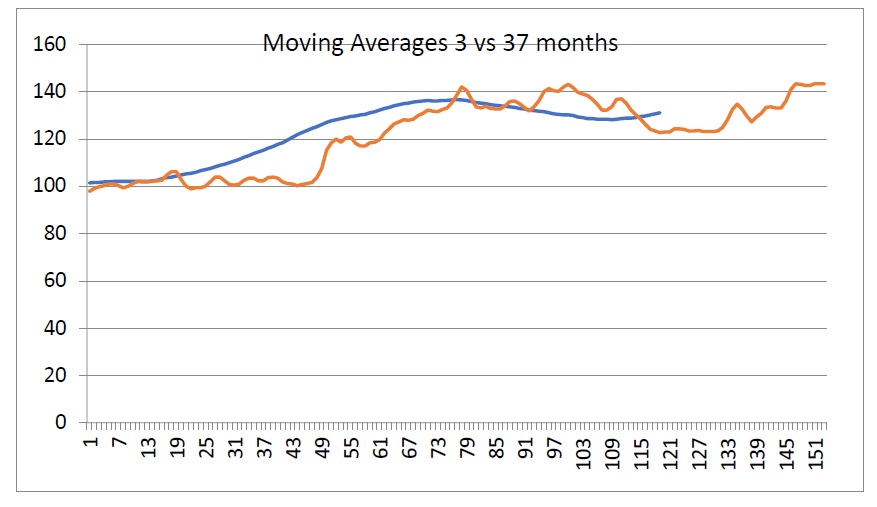
As the Chart shows, the quarterly moving average (MA-3; blue line) is superimposed on the business cycle moving average (MA-37; orange line).
For the period under review, the 11 crossover or meeting points over 12 years indicate that electricity prices can be quite frisky.
The next probable crossover point when the two moving averages meet can be anytime in the second half of 2019. July, October, and December are the best bets, if and when electricity prices fall. The most likely scenario is for the quarterly moving average to exert upward pressure on the business cycle moving average. After all, it has to recover much lost ground since 2006.
VI. Recapitulation
To wrap up this episode of the national conversation, it hereby averred that the revenue picture for 2006-2017 looks good at first pass, with its average annual growth of 3.25%. (Infra. Table I). However, the cost picture shows that the average growth of prices for all items was 4.5%. (Infra, Table II) over the period. Considering that the costs are incurred earlier than revenues, it takes good fortune to get past a cash flow squeeze.
Sine qua non, the “luck of the Irish” comes in the form of the RORB that allows profits, revenues minus costs, to be based on the value of assets deployed in the business, essentially return on assets (ROA). While a maximum 12% RORB based on equity is allowed under existing rules, inflation is always an erosive factor that eats into profits after tax.
In summary, 2006-2012 cannot be very good years for the electricity business, especially, the power generation developers who get less than half (about 48%) of what consumers pay for, as an ordinary person can check at the back of his electricity bill. On balance, the demand for more electricity increases revenues over time, but those increase costs in the short-term and cannot be sustained over the long-term without increasing the capacity to produce more electricity to keep pace with increasing demand, way before it happens.
VII. Moving Forward!
In the face of the need to double up on the generation capacity onward to 2029, there is an optimism that new players will find the business attractive to put big sums into it, even as the other items in the CPI market basket proffer better returns, inflation considered or not.
On the other hand, consumers want lower electricity bills, as other prices in the Philippines market rise.
On the one hand, the producers have to pay for fuel, supplies, and other expenses, before any kilowatt of electricity is produced. In the face of higher prices whether occasioned by exchange rate changes or not, the maximum RORB of 12% keeps power generating stations afloat, but someone must ultimately pay for the costs. Indeed, increasing demand is a blessing if one can keep with the production capacity required and the prices of inputs that increase faster than the revenues do.
Through good times and bad, the industry players always prudently manage their role as well as they can. That track record is the “silver lining” that any investor will consider as attractive about the industry in the years to come. That gives hope for possibly lower prices in the future when more debt financing becomes available. (Infra, Profits).
Lest the wrong impressions persist, it deserves mention that the power generation industry’s unrecognized role is to mandatorily repay the debts owed according to schedule or else everything comes down, including their equity. That move is a forced one, because it is the creditors who can put in more money than anybody else, in order to get the business started.
To close this episode, EPI forecasts are mentioned boldly for December 2018 and for 2029, based on logical trend, not persuasion.
For this coming year-end, an EPI (2012=100) of 102.98 is what the numbers indicate; that is between 102.03 and 103.92, assuming that 5% error is acceptable. The latter denotes a 2.98% increase in electricity prices from the EPI 2012 average and a December 2018 inflation rate of 7%. (Infra. Table VII).
On the other hand, the trend according to the EPI (2006=100) discontinued series points to an EPI of 144.2, indicating a 44.2 increase from the average EPI in 2006 and 7.9% inflation for December 2018. (Infra. Table VI).
For the longer term forecasts, forward to 2029 indicates that the electricity price index will be almost double than they were in 2006. (Infra. Table IV).
Whether the forecasts come true or not is secondary to the national conversation itself. Fast-forward, it is important to come together to a national consensus on issues surrounding power generation, among others. Who knows, maybe a consensus can be crafted towards a triennial moratorium on price increases, as proposed jointly a few decades ago by the economists John Kenneth Galbraith and Nicole Salinger?
With this second call for a national conversation, the die is cast. Either it happens or the country is to idly watch prices rise in the years to come. The next call: finding intelligent, real solutions that can come through; neither whims nor palliatives..


